These Are The US Cities And States With The Longest Work Commutes
The American commute is getting longer - and more miserable, data reveals.
Workers are spending nearly one hour each day getting to and from work in the country’s biggest cities, which is a considerable chunk on top of the average 8.3-hour working day.
Some urban sprawls, such as New York, will spend even longer traveling back and forth - and things are only getting worse.
Commute times have been rising across the country, according to the latest U.S. Census Bureau data, with some cities seeing as much as a 12% increase in just three years.
It’s bad news—not just for workers, but for businesses too.
Studies highlight that longer commutes are linked to lower job satisfaction, higher absenteeism, and an increased intention of quitting.
In fact, further research reveals that every extra minute can be detrimental to employee happiness, with an added 20 minutes being found to have the same impact as taking a 19% pay cut.
So, with commute times rising, job satisfaction across the country is likely taking a hit - and in some areas more than others.
We analyzed the latest government data across all 50 states and the nation’s biggest cities to uncover where workers are likely to feel the impact the most.
Read on below to find out.
The US Cities With The Biggest Commuting Increase.
Key findings.
- The average American spends around 235 hours each year commuting to and from work, based on the typical 260-working-day year in the U.S.
- The average percentage increase in commute time over the three years was 2.94%.
- Most cities saw commute times increase over the three years, other than the eight cities that recorded lower commute times in 2023 than in 2021.
- Californian cities dominate the list of highest commute times, which is likely due to the congestion and housing affordability pushing workers further from the city centers.
- Densely populated urban areas, such as New York City and Chicago, report the longest commute times overall, but their percentage increases were relatively low, suggesting a more stable commute time.
In-Depth Look at the Cities with Significant Commute Times.
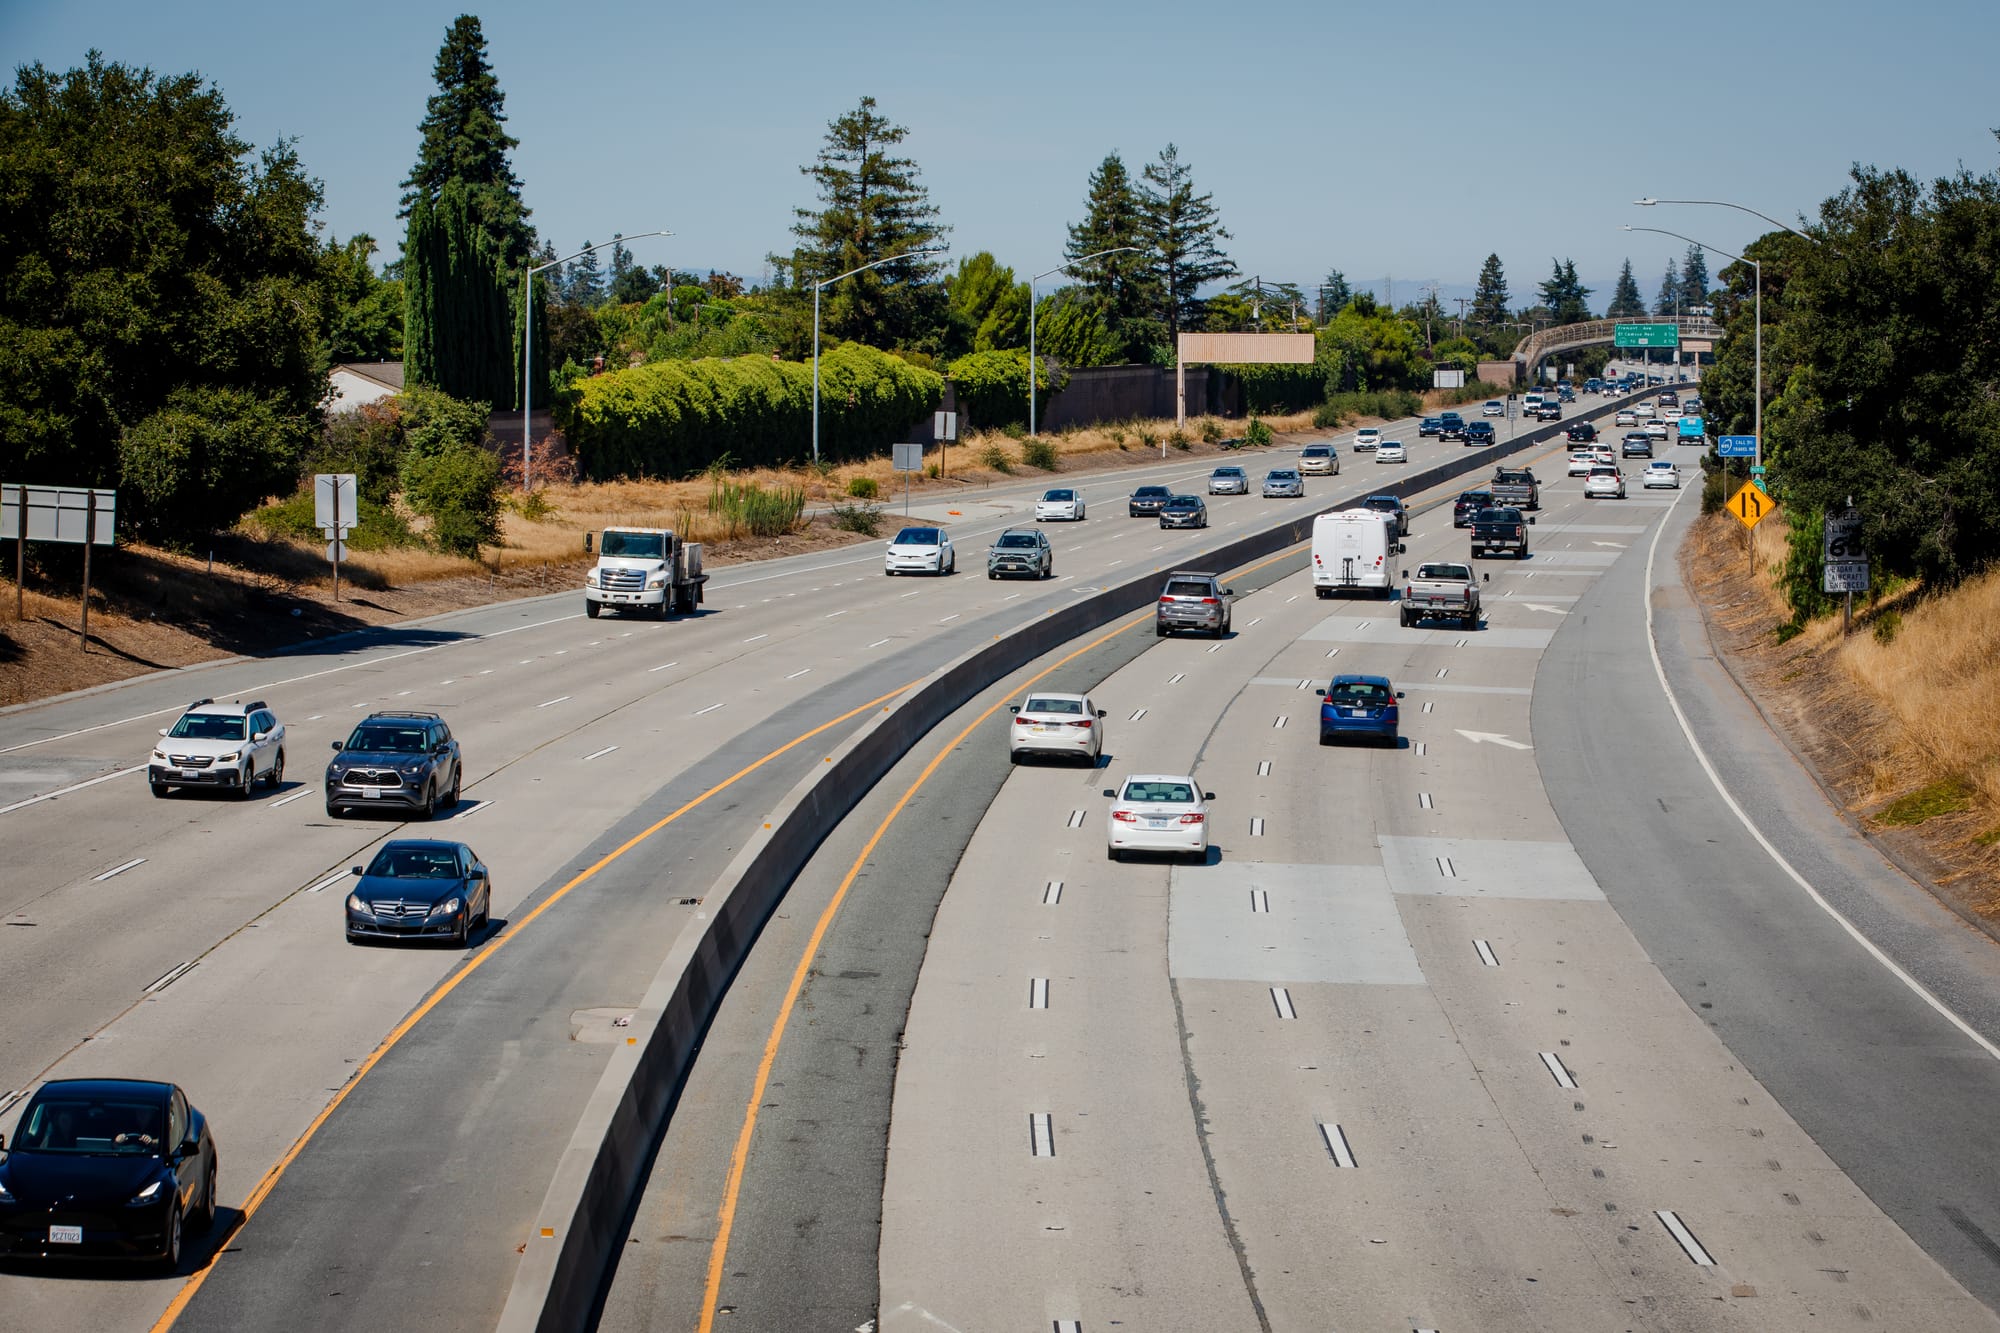
San Jose, CA.
Our research revealed that San Jose was the US metropolitan that saw the sharpest increase in commute times.
With a growth of 12% between 2021 and 2023, the average commute time in the Californian city rose from 26.64 minutes to 30.36.
Considered the birthplace of Silicon Valley, San Jose is home to more than 2,500 high-tech companies, including the giants of Adobe, Cisco, eBay, and PayPal. Just last year, Elon Musk announced that he would be closing X's San Francisco flagship and instead moving workers to existing San Jose offices.
Therefore, it is perhaps unsurprising that San Jose experienced the biggest increase in this, especially considering that 91% of commuters in the metropolitan use their cars to get to work, according to studies.
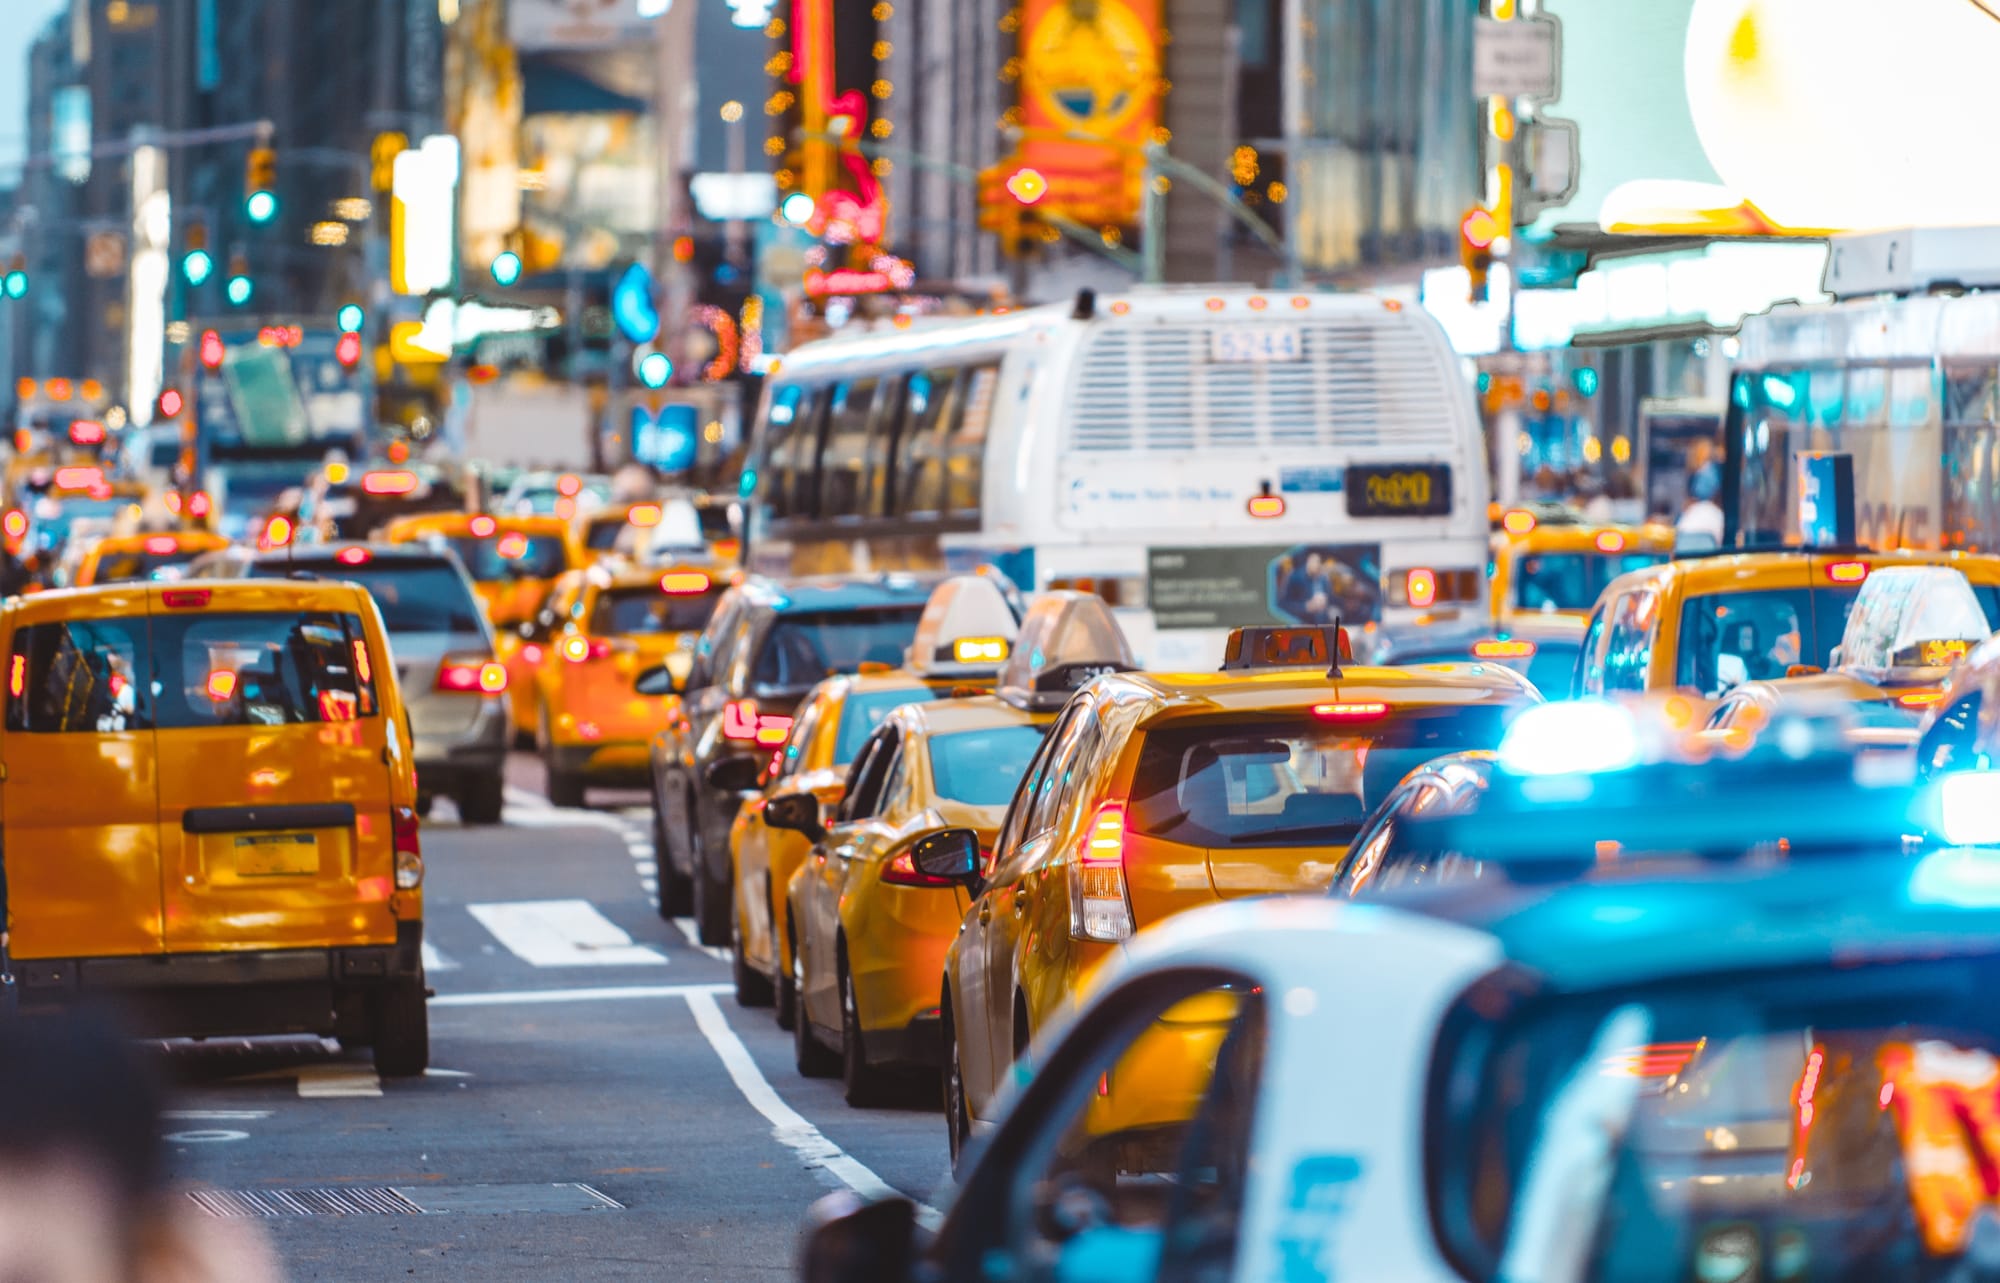
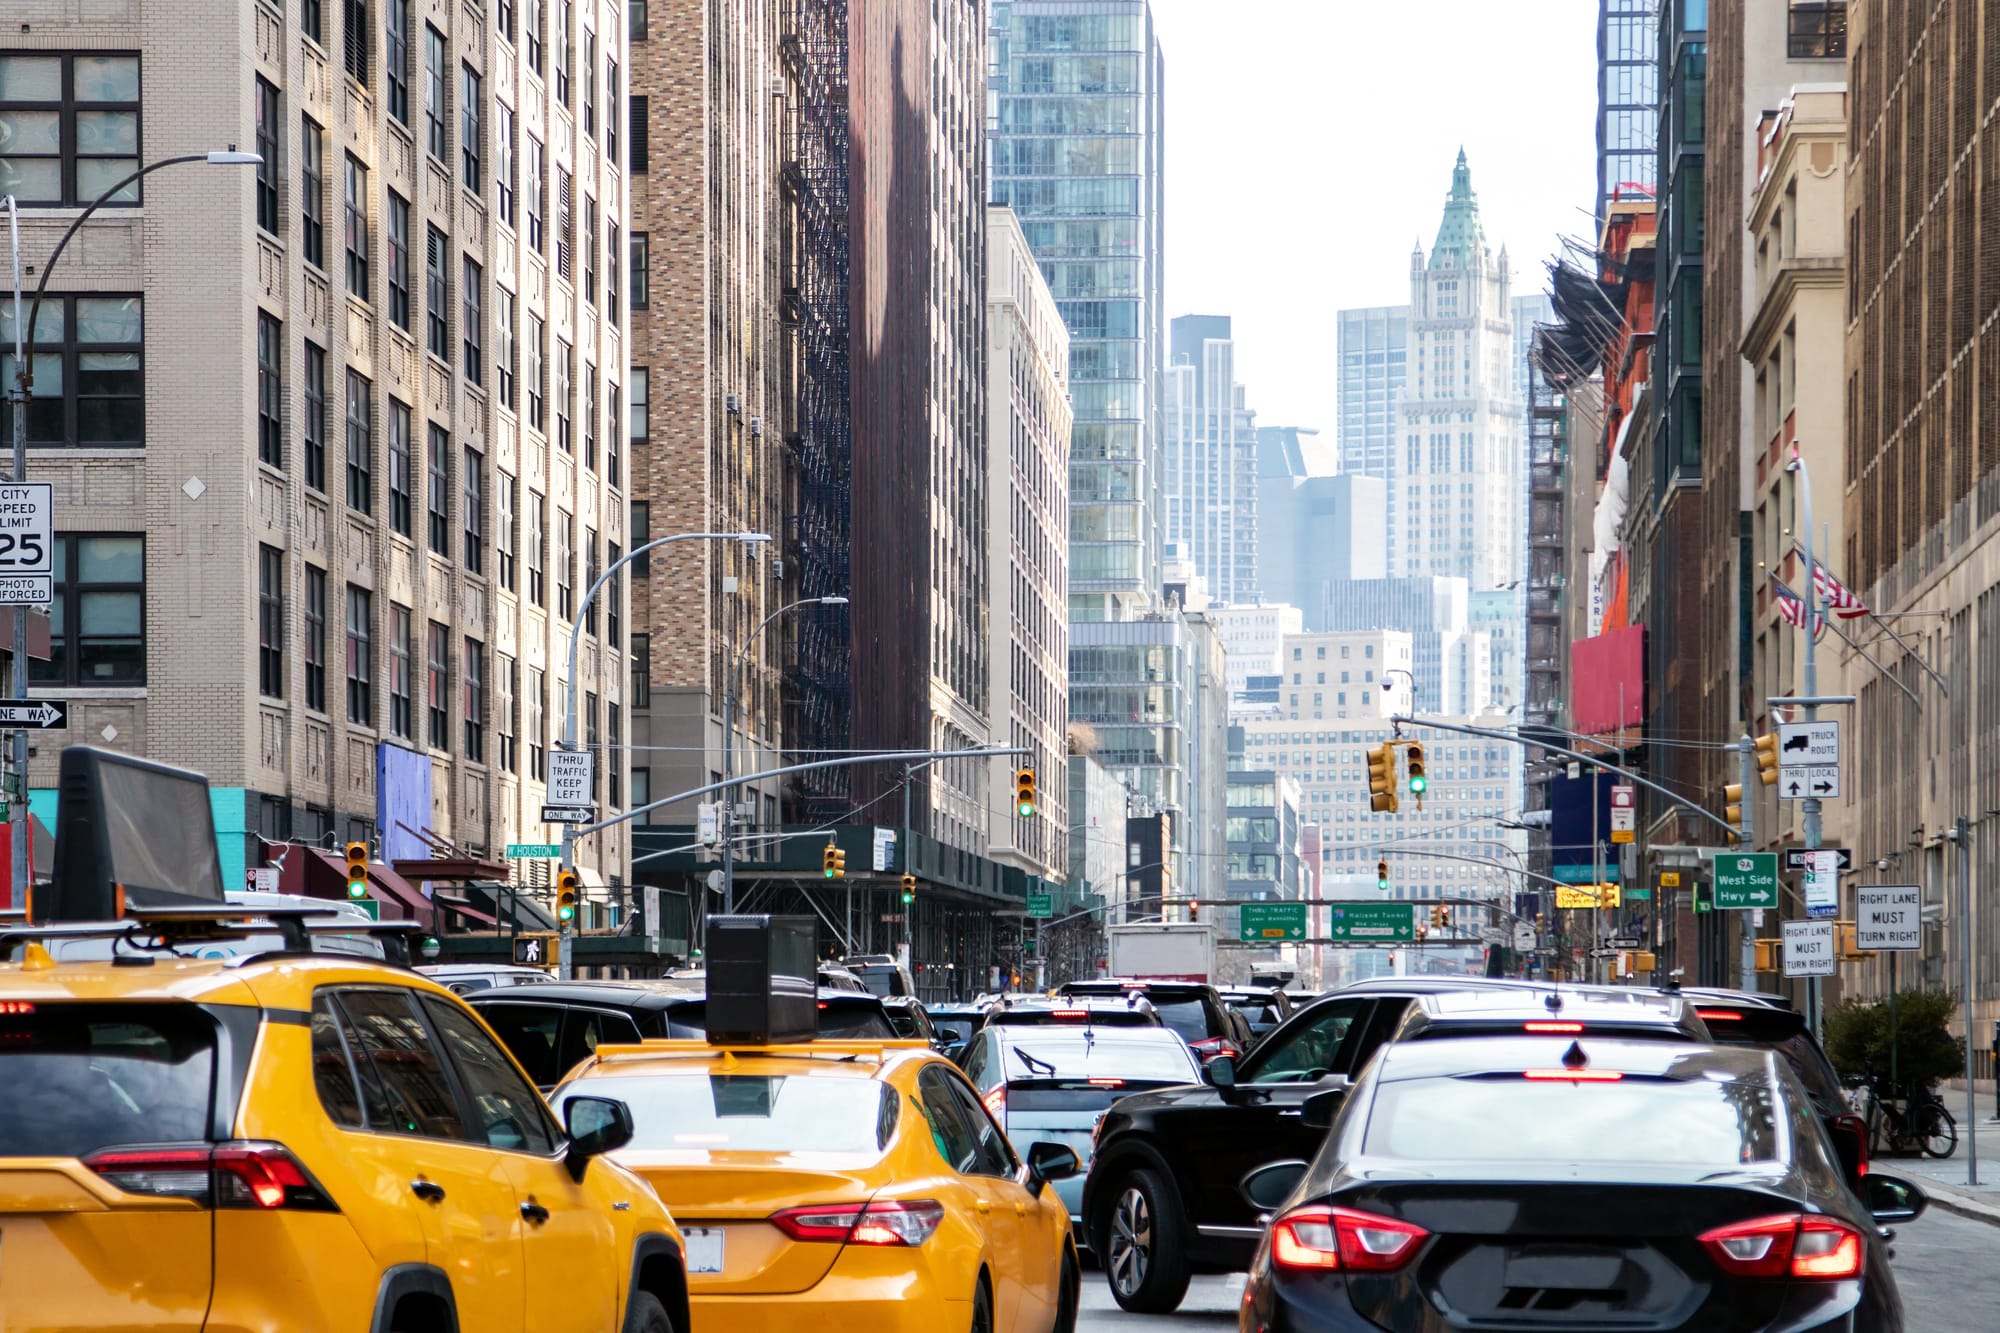
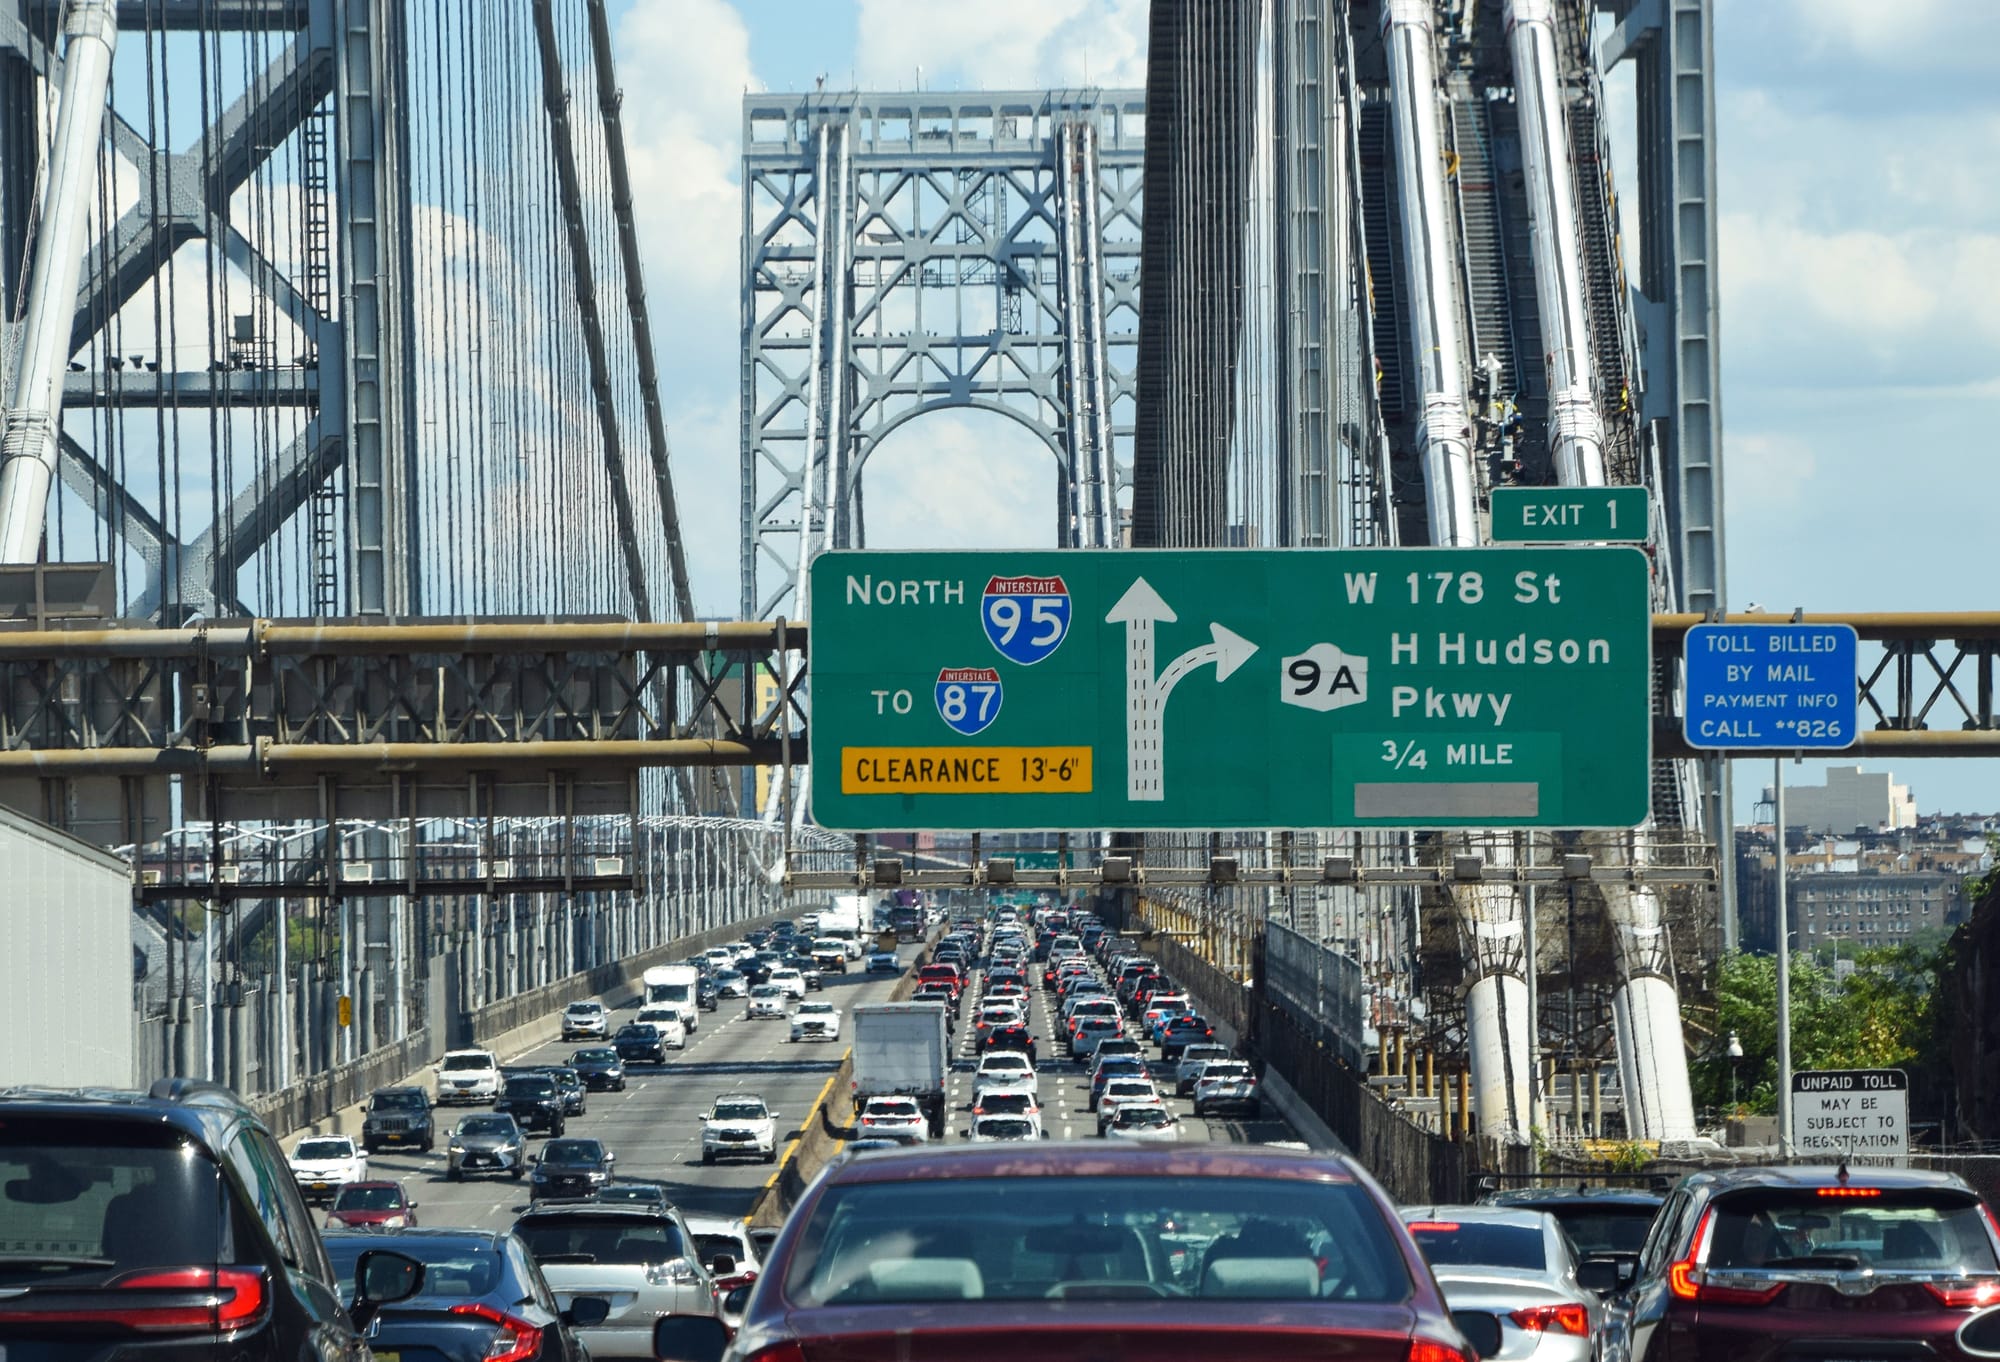
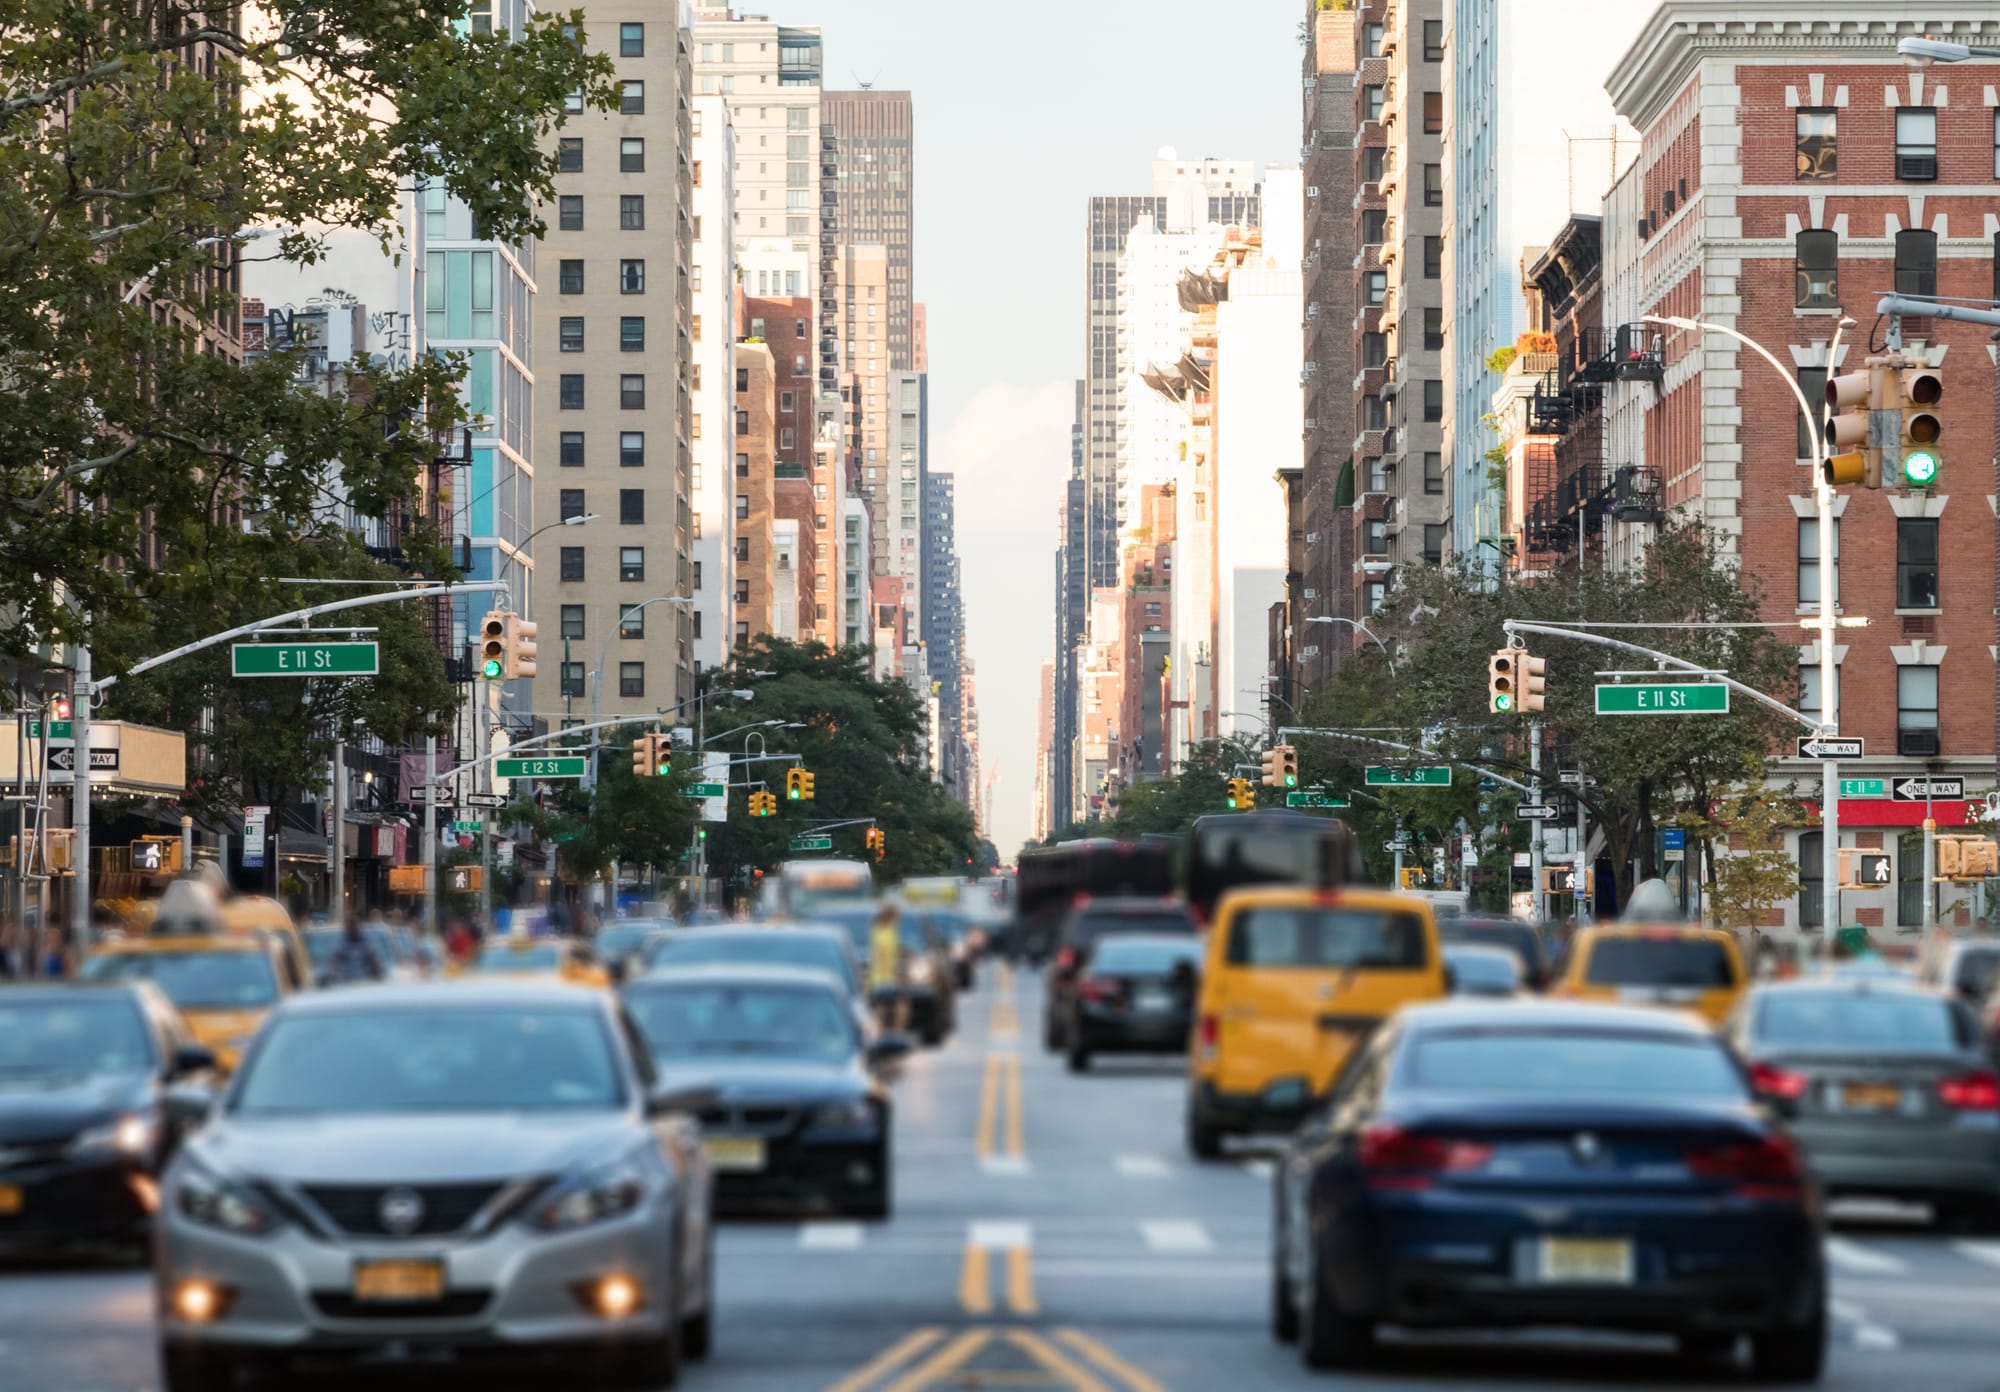
New York City, NY.
The US Census Bureau data reports that the average travel time for New York workers is around 44 minutes, making it the city with the longest overall commute in the study.
In a bid to combat its notorious traffic problems, New York recently became the first US city to implement a congestion charge. It appears to have worked so far too, with weekday traffic being down 7.5% since the scheme was put in place.
It comes at a price though. Drivers will now pay a $9 daily fee to enter the congestion zone during peak hours, which adds around $180 a month to their commuting costs.
The new charge is expected to route more vehicles through the South Bronx, increasing traffic outside the central business district and thus impacting those who have always traveled through other neighborhoods on their commute.
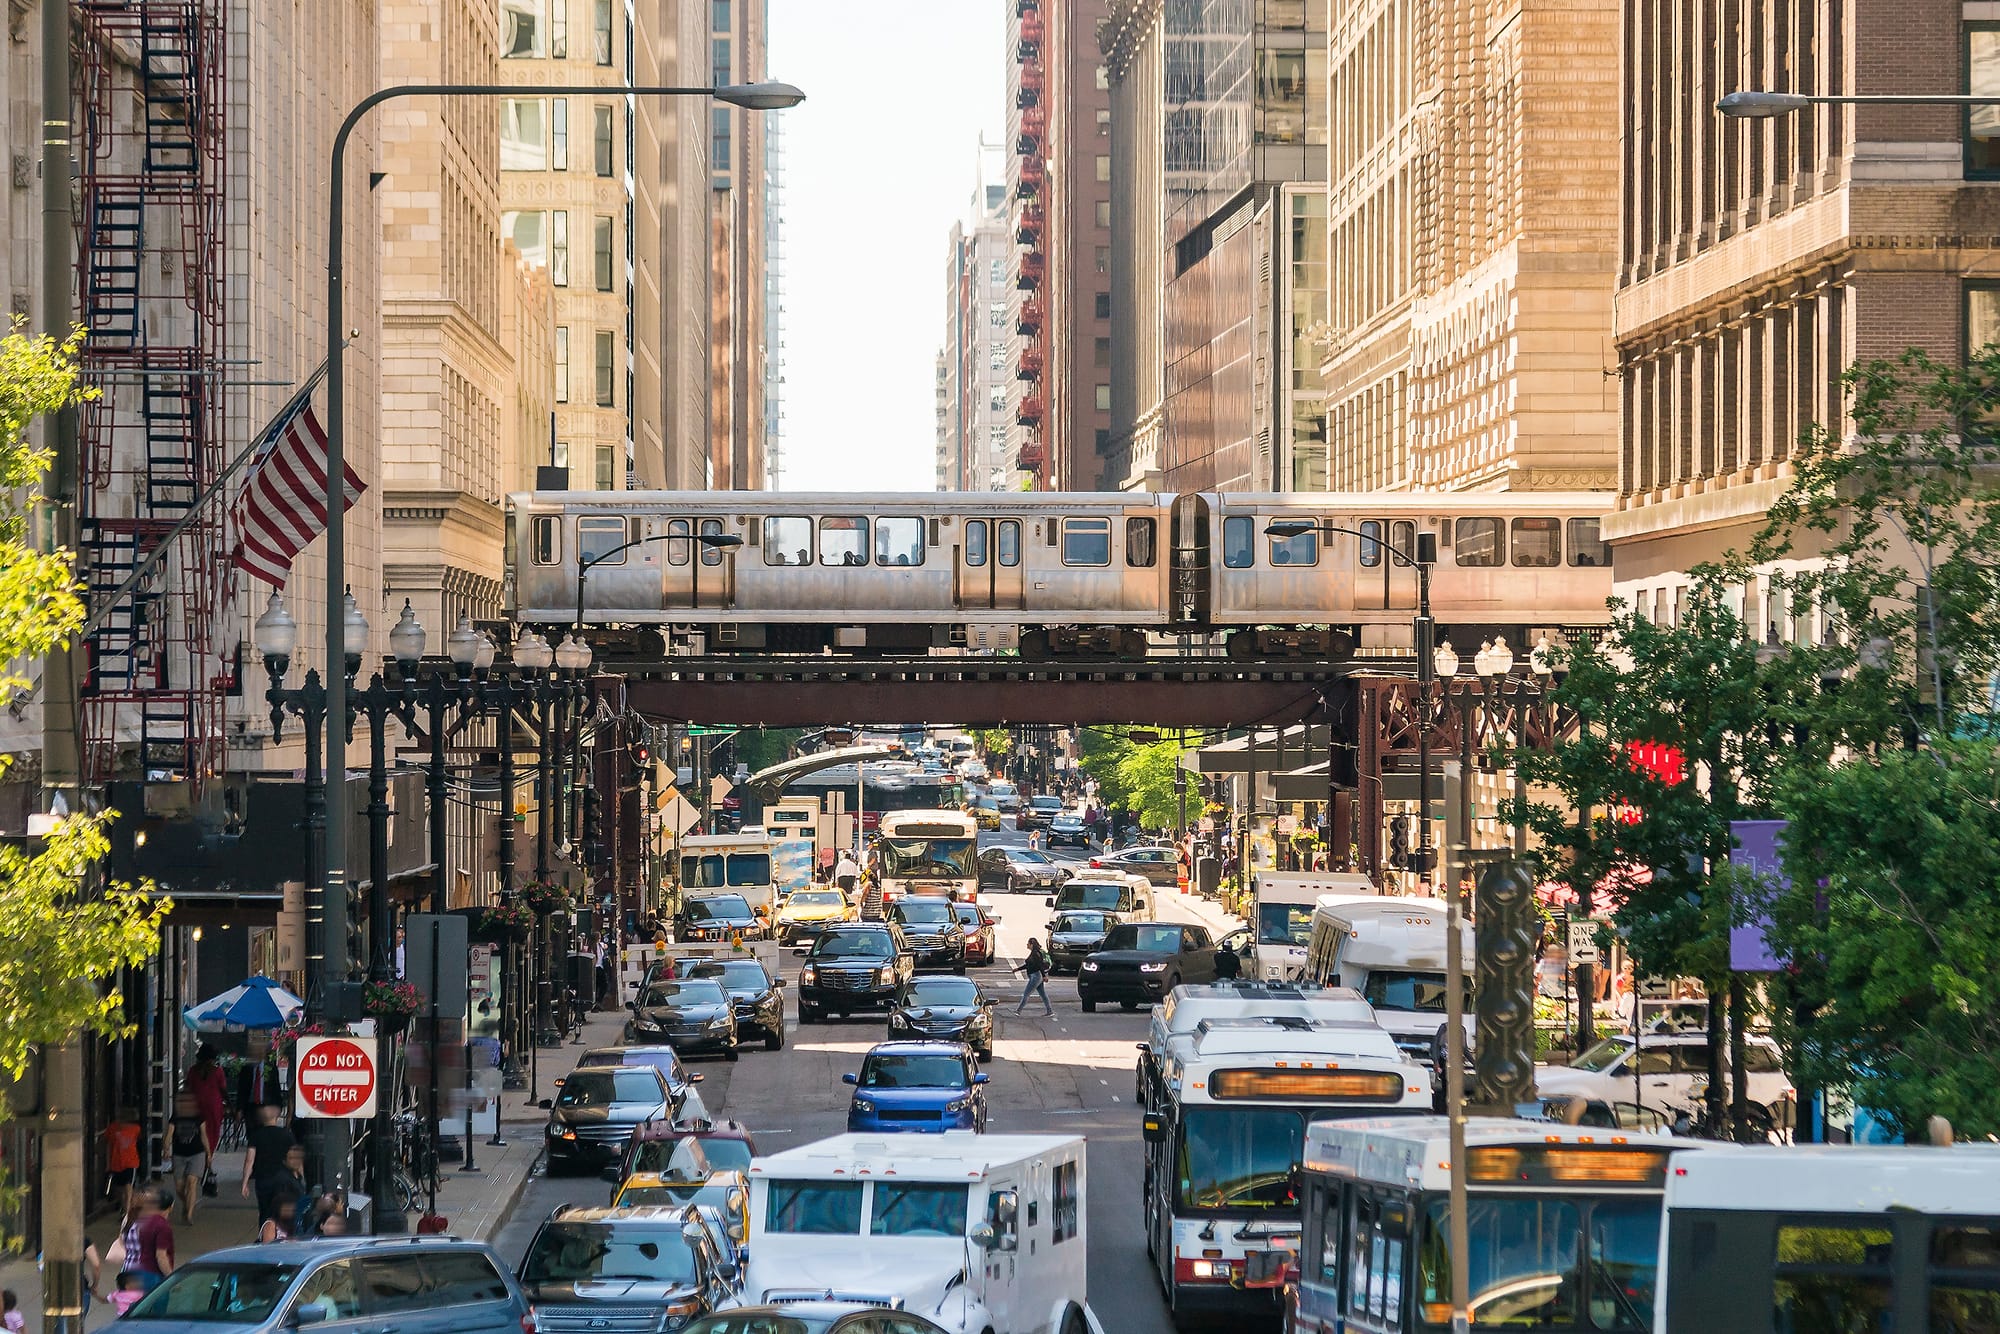
Chicago, IL.
Chicago is another US metropolitan that has earned itself a bad reputation for rush hour traffic.
In fact, Chicago was named as having the second-highest traffic delays in the world last year, with a study revealing that drivers there spent an average of 102 hours sitting in traffic in 2024, which is a 6% increase from the year before.
And, when it comes to commuting on Chicago’s roads, our research found that Chicago workers could be spending 14 full days each year driving to and from work, with an average one-way length of 36.34 minutes in the city.
Considering that more than two-thirds (69.2%) of workers drive alone to work, it’s no surprise that people might spend their extended commuting time stewing on their current work arrangements.
The US States With The Biggest Commuting Increase.
In-Depth Look at the States with Significant Commute Times.
New Jersey.
New Jersey reports the sharpest increase in commuting times across the country. Not just that, the state also ranks third for the longest journey time overall.
With a high concentration of people living close to major cities like New York and Philadelphia, the state struggles with congested roads and often significant delays on its highways and bridges.
Our study reveals that commute times in New Jersey jumped by 8.79% between 2021 and 2023, with the latest census data reporting that the average journey for workers in the state now takes 35.72 minutes.
New York.
The US Census Bureau data reports that the average travel time for New York workers is around 44 minutes, making it the city with the longest overall commute in the study.
In a bid to combat its notorious traffic problems, New York recently became the first US city to implement a congestion charge. It appears to have worked so far too, with weekday traffic being down 7.5% since the scheme was put in place.
It comes at a price though. Drivers will now pay a $9 daily fee to enter the congestion zone during peak hours, which adds around $180 a month to their commuting costs.
The new charge is expected to route more vehicles through the South Bronx, increasing traffic outside the central business district and thus impacting those who have always traveled through other neighborhoods on their commute.
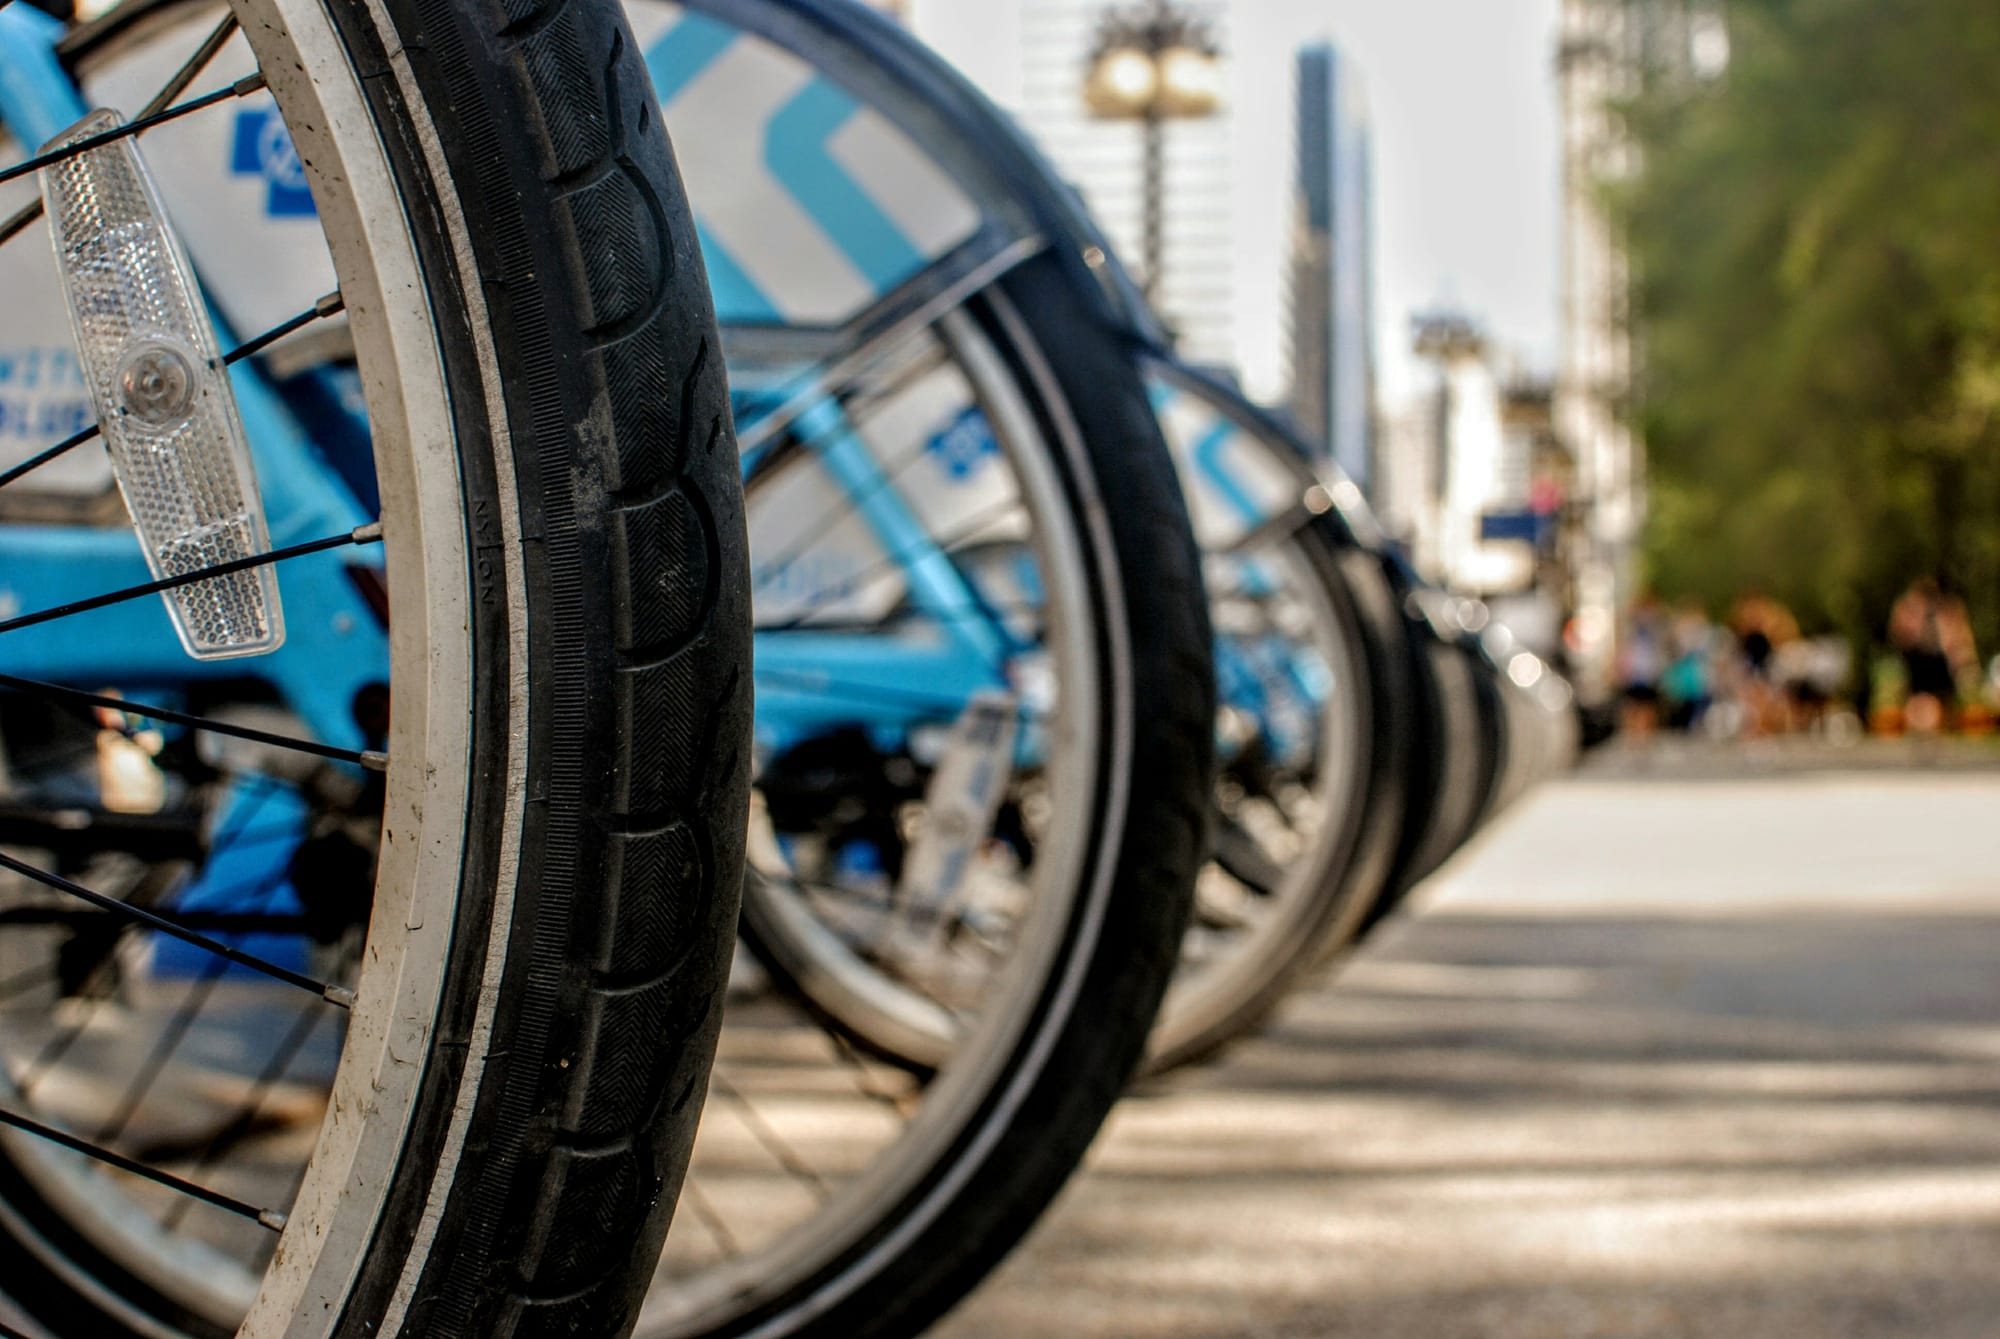
Why commuters should consider cycling.
Many studies reveal that cyclists are the most satisfied commuters and that switching from a car or public transport to a bike for your commute seems to have a noticeable boost on wellbeing.
There are lots of reasons why this may be the case with benefits including:
Helping people keep fit and healthy
- Cutting carbon emissions for our planet
- And, of course, avoiding the frustration of traffic jams!
Data from the US Department of Transportation illustrates a growing trend in cycling commutes over the past few years. However, despite this, only about 1% of Americans currently bike to work.
So, for companies looking to ease commuting frustrations among employees, promoting cycle-to-work programs could be a great solution.
Another benefit that perhaps many people overlook is that cycling to work can save you money. Quite a bit of money, in fact.
At buycycle, we discovered just how much commuters can save in their region by opting to cycle instead of using other forms of transportation, and the findings are quite impressive. Check it out here!
Methodology.
To determine the U.S. destinations most at risk of disgruntled employees, buycycle analyzed all of the states along with the country’s 50 biggest cities.
We used official US Government data to find out the average commute across these in 2023, 2022, and 2021, before analyzing the increase in figures over the three years.
Data is correct as of January 2025. A full dataset is available upon request.